Utilizing Project Reports
Purpose: the purpose of Project Reports, is to provide a quick overview of the amount of time that has been invested in a graphical fashion. These reports can help to get a quick glance of all the people who have worked and the areas that have been worked upon on a given project, and also helps to get the graphical view all the projects being worked by a person and all the areas in which the person has spent any time on.
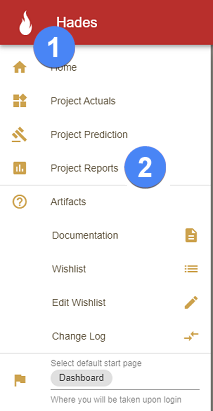
Navigating to Project Reports
| # | Name | Description |
|---|---|---|
| 1 | Navigation Drawer | Hades logo provides a way to open the navigation drawer, which provides navigation options. |
| 2 | Project Reports | Upon clicking this button, the user will be sent to the Project Reports page. |
All Projects/People at a glance
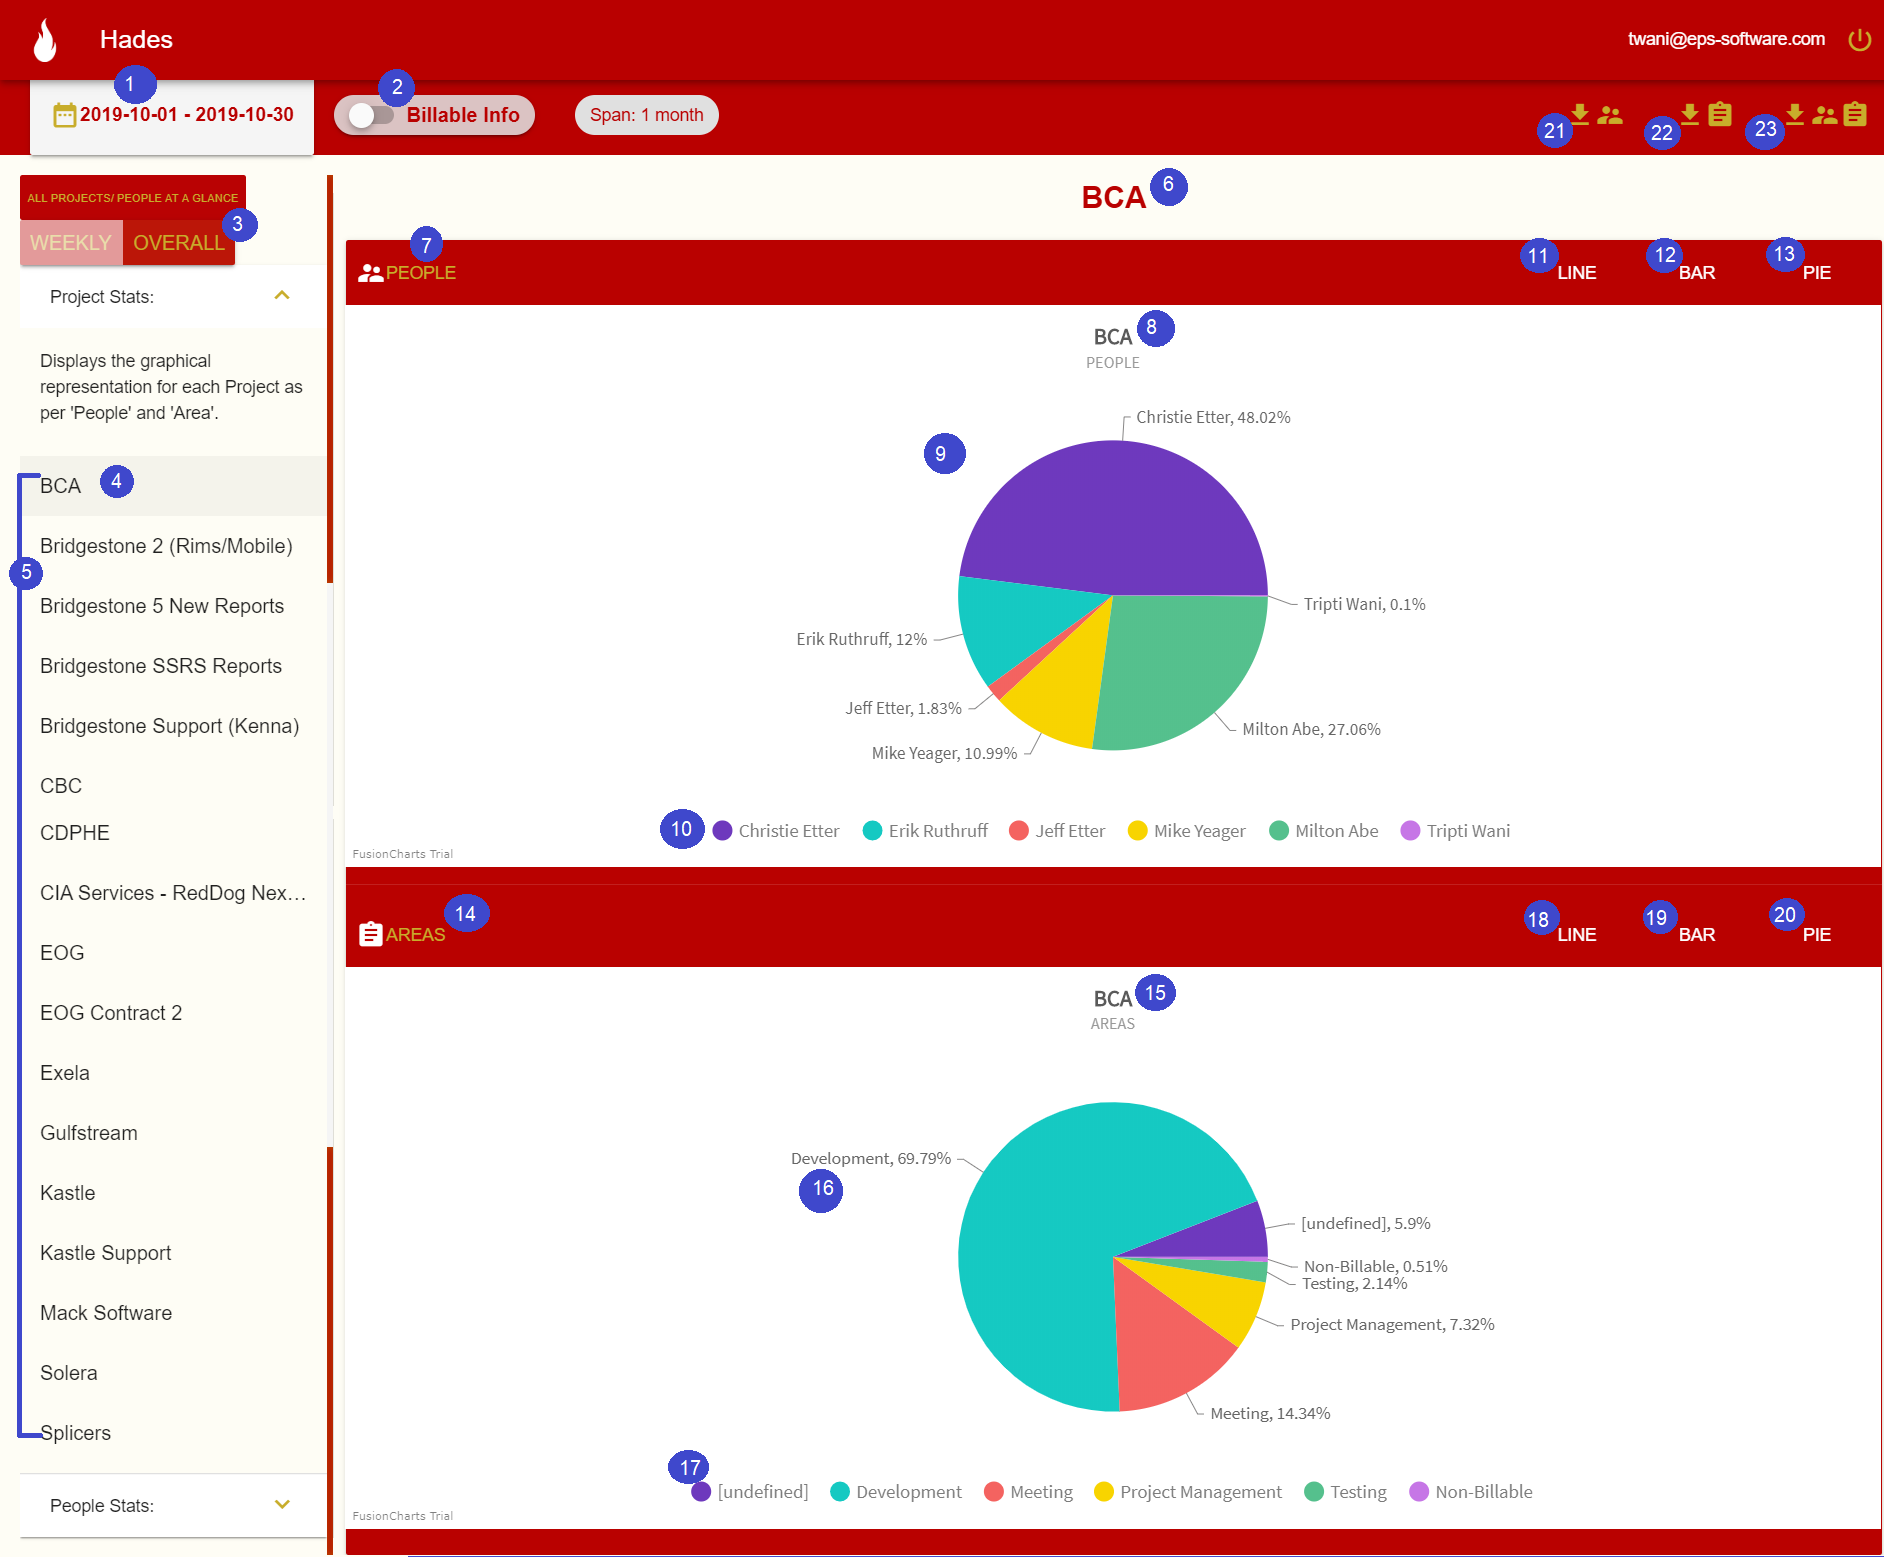
Billable Projects View
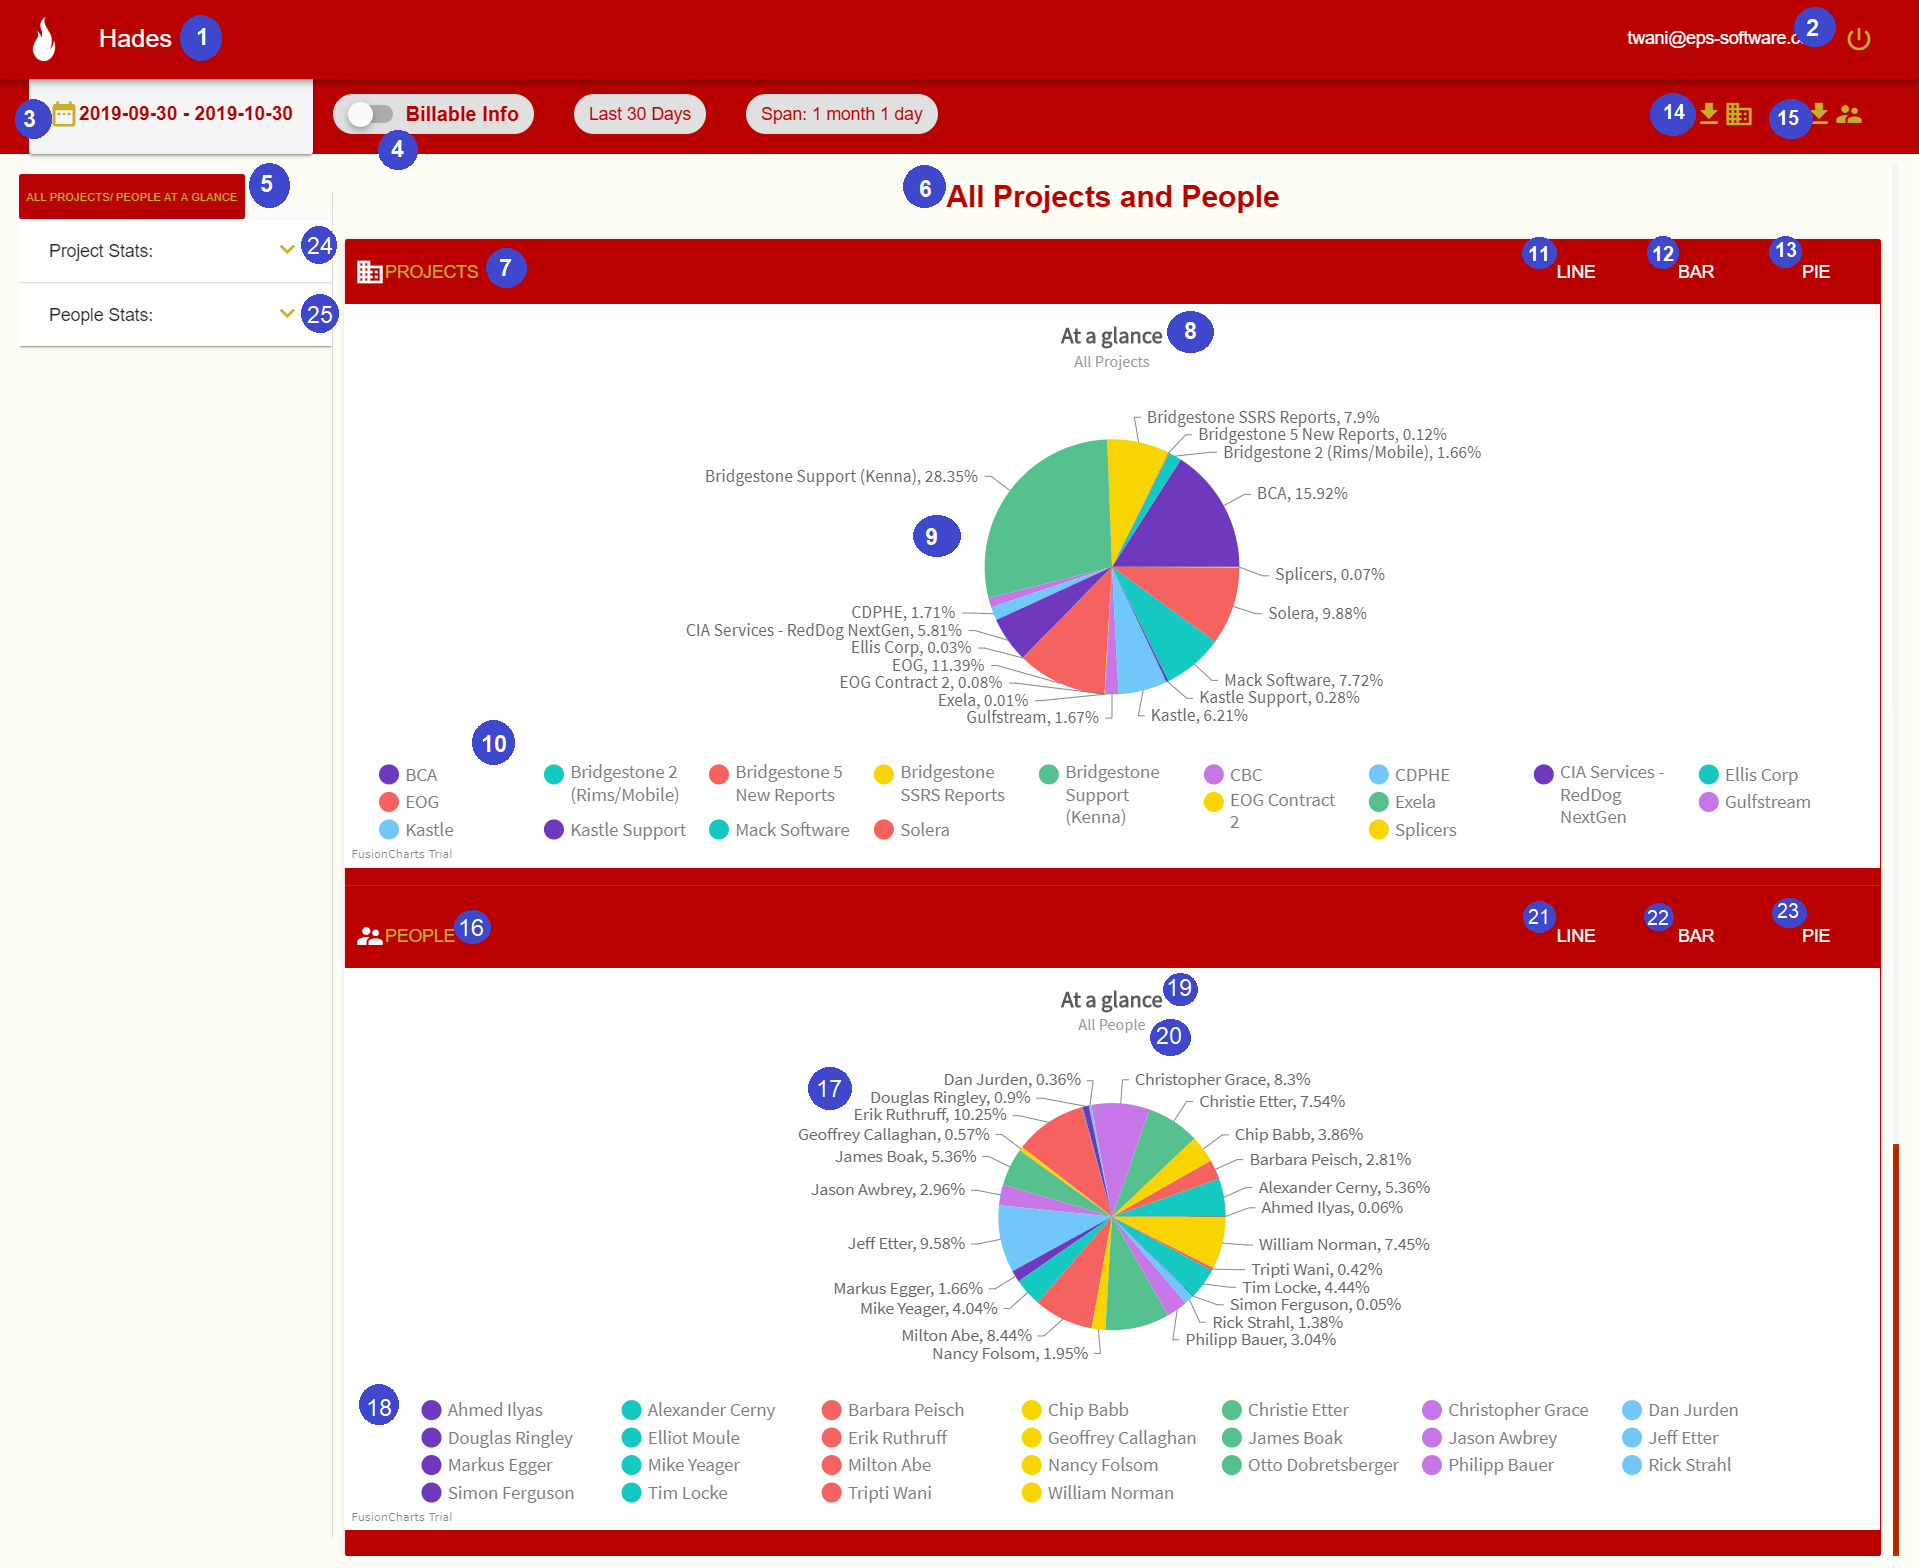
This page displays the details of all the billable Projects only in a Pie chart(referred to as Graph 1 later) and all the People in another Pie chart(referred to as Graph 2 later).
| # | Name | Description | |
|---|---|---|---|
| 1 | Heading | Heading of the page. | |
| 2 | Log Out | Upon clicking this button, the user will be logged out, and their session cleared. | |
| 3 | Calendar | Upon clicking this, the calendar range box will appear, wherein the user can select the date range for the view. | |
| 4 | Billable Info | This is the switch to include or exclude the non-billable information on the charts displayed on this page. | |
| 5 | All Projects/People at a glance | This label/button when clicked will display the overall charts for all the projects and people, irrespective of the projects and areas they work upon. | |
| 6 | Graphs Title | This label provides the information of the Title for which the charts have been displayed. | |
| 7 | Graph 1 Category | This label provides the name of the category for which the chart for Graph 1 is displayed. For instance, when ‘All Projects/People at a glance’ is selected, the first chart on the web page is about ‘Projects’. | |
| 8 | Graph 1 Caption | This label provides the name of the caption for which the chart for Graph 1 is displayed. It can be Peroject name or person name for other views. | |
| 9 | Graph 1 Pie Chart | This is the pie chart representation of all the projects within the company, for the calendar range period. Pie chart is the default view for the graphical representation. | |
| 10 | Graph 1 Pie Chart Labels | This gives the information about the various parts of the Pie Chart in Graph 1 above, gives the information about the labels. | |
| 11 | Graph 1 - Line Chart View | This button when clicked will display Graph 1 in a Line chart fashion. | |
| 12 | Graph 1 - Bar Chart View | This button when clicked will display Graph 1 in a 2-D Bar chart fashion. | |
| 13 | Graph 1 - Pie Chart View | This button when clicked will display Graph 1 in a Pie chart fashion. | |
| 14 | Graph 1 - Download as Excel | This button when clicked will export the details present in Graph 1 in Excel(csv) format. | |
| 15 | Graph 2 - Download as Excel | This button when clicked will export the details present in Graph 2 in Excel(csv) format. | |
| 16 | Graph 2 Category | This label provides the name of the category for which the chart for Graph 2 is displayed. For instance, when ‘All Projects/People at a glance’ is selected, the first chart on the web page is about ‘Projects’. | |
| 17 | Graph 2 Pie Chart | This is the pie chart representation of all the people within the company, for the calendar range period. Pie chart is the default view for the graphical representation. | |
| 18 | Graph 2 Pie Chart Labels | This gives the information about the various parts of the Pie Chart in Graph 2 above, gives the information about the labels. | |
| 19 | Graph 2 Caption | This label provides the name of the caption for which the chart for Graph 2 is displayed. It can be Project name or person name for other views. | |
| 20 | Graph 2 SubCaption | This label provides the subcaption or any other details for Graph 2. This can also display any additional details which need to be displayed. | |
| 21 | Graph 2 - Line Chart View | This button when clicked will display Graph 2 in a Line chart fashion. | |
| 22 | Graph 2 - Bar Chart View | This button when clicked will display Graph 2 in a 2-D Bar chart fashion. | |
| 23 | Graph 2 - Pie Chart View | This button when clicked will display Graph 2 in a Pie chart fashion. | |
| 24 | Project Stats | This label is the expansion panel to display the graphical representation for each Project as per ‘People’ and ‘Area’. It expands to a list of all the projects being worked upon in the selected time period. | |
| 25 | People Stats | This label is the expansion panel to display the graphical representation for each Person as per ‘Project’ and ‘Area’. It expands to a list of all the people who have worked during the selected time period. |
Billable and Non-Billable Projects View
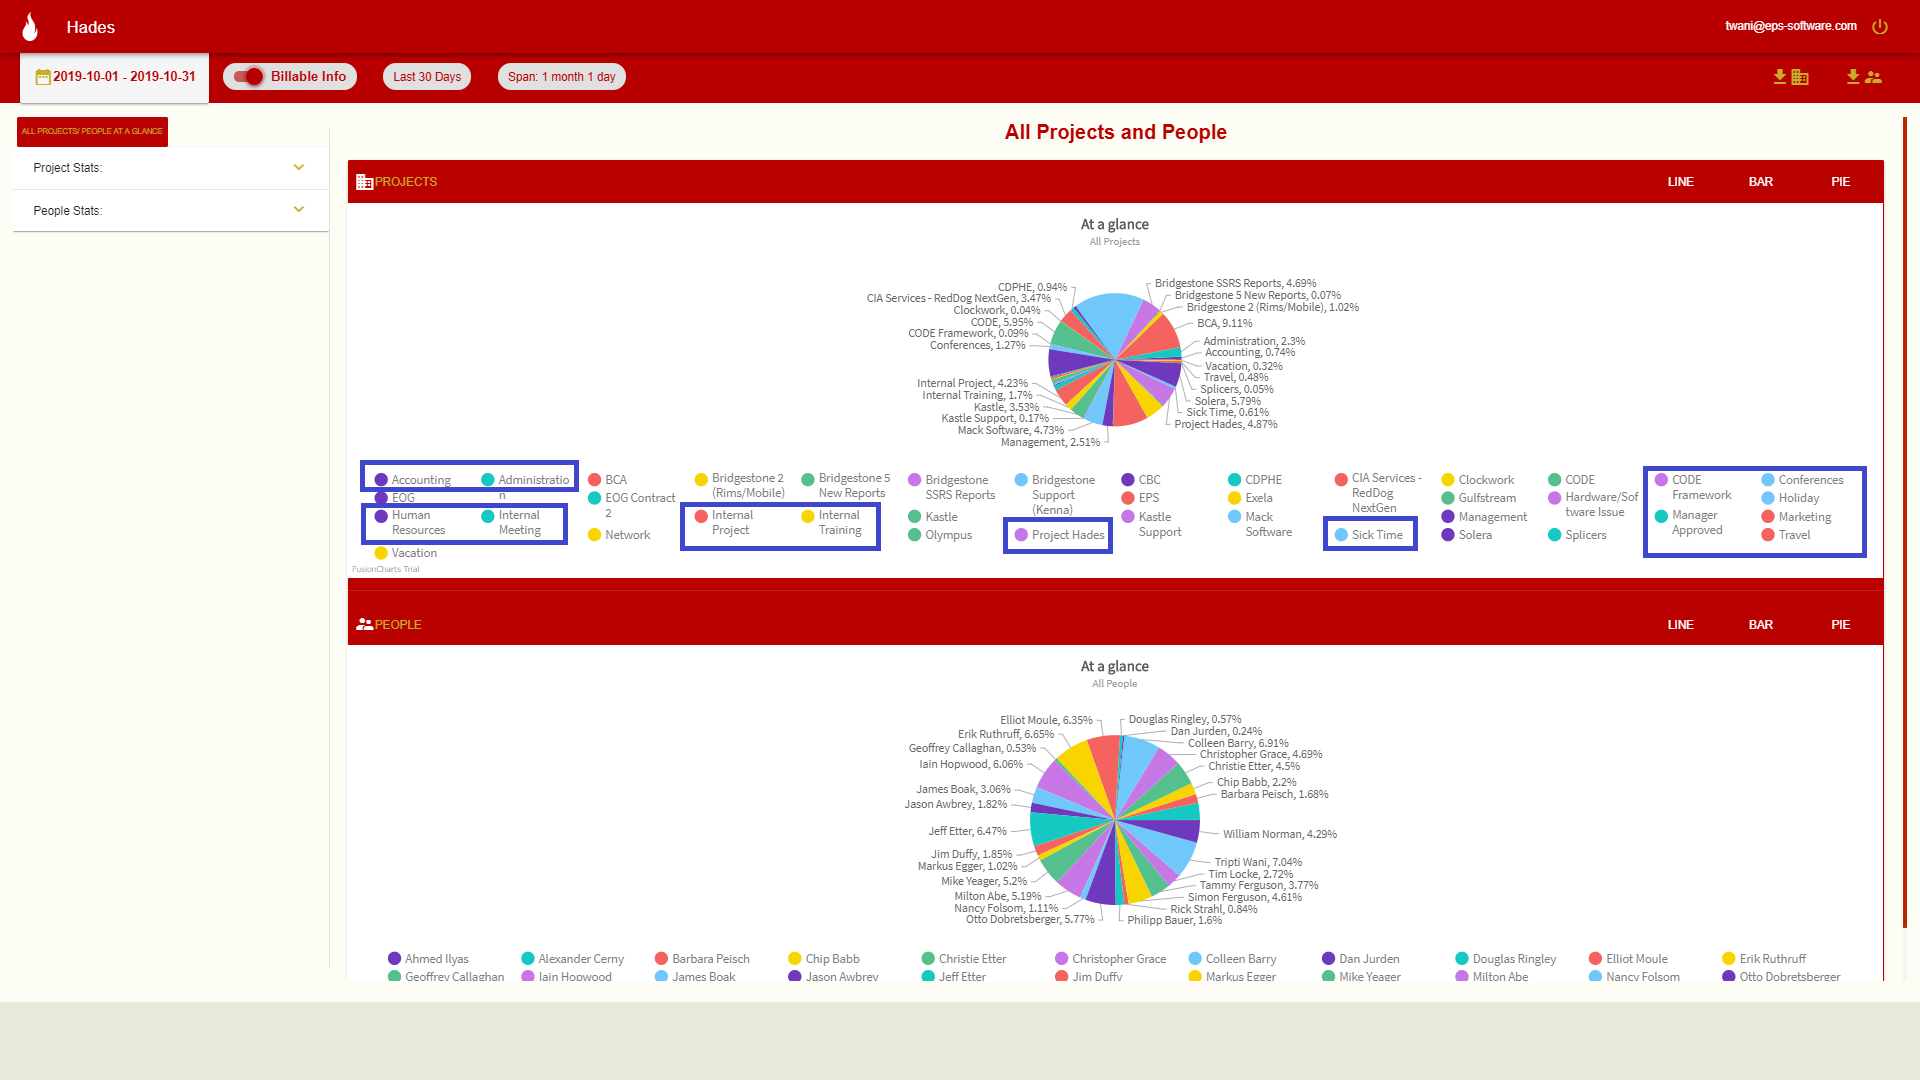
The following image displays the details of all(billable and non-billable) the Projects in a Pie chart and all the People in another Pie chart. A few of the non-billable Projects have been outlined in blue.
Project Stats
This section displays the graphical representation for each Project in two categories ‘People’ and ‘Area’ for the selected time period.
Features:
- The details about time spent by each person and time spent in each area can be exported in Excel format for any selected project. (available only for Overall statistics.)
- The graphical representation can be viewed in Pie charts, Bar graphs or Line charts format.
- The graphs can be displayed for weekly or overall time spent in each category for a project based on the users requirement.
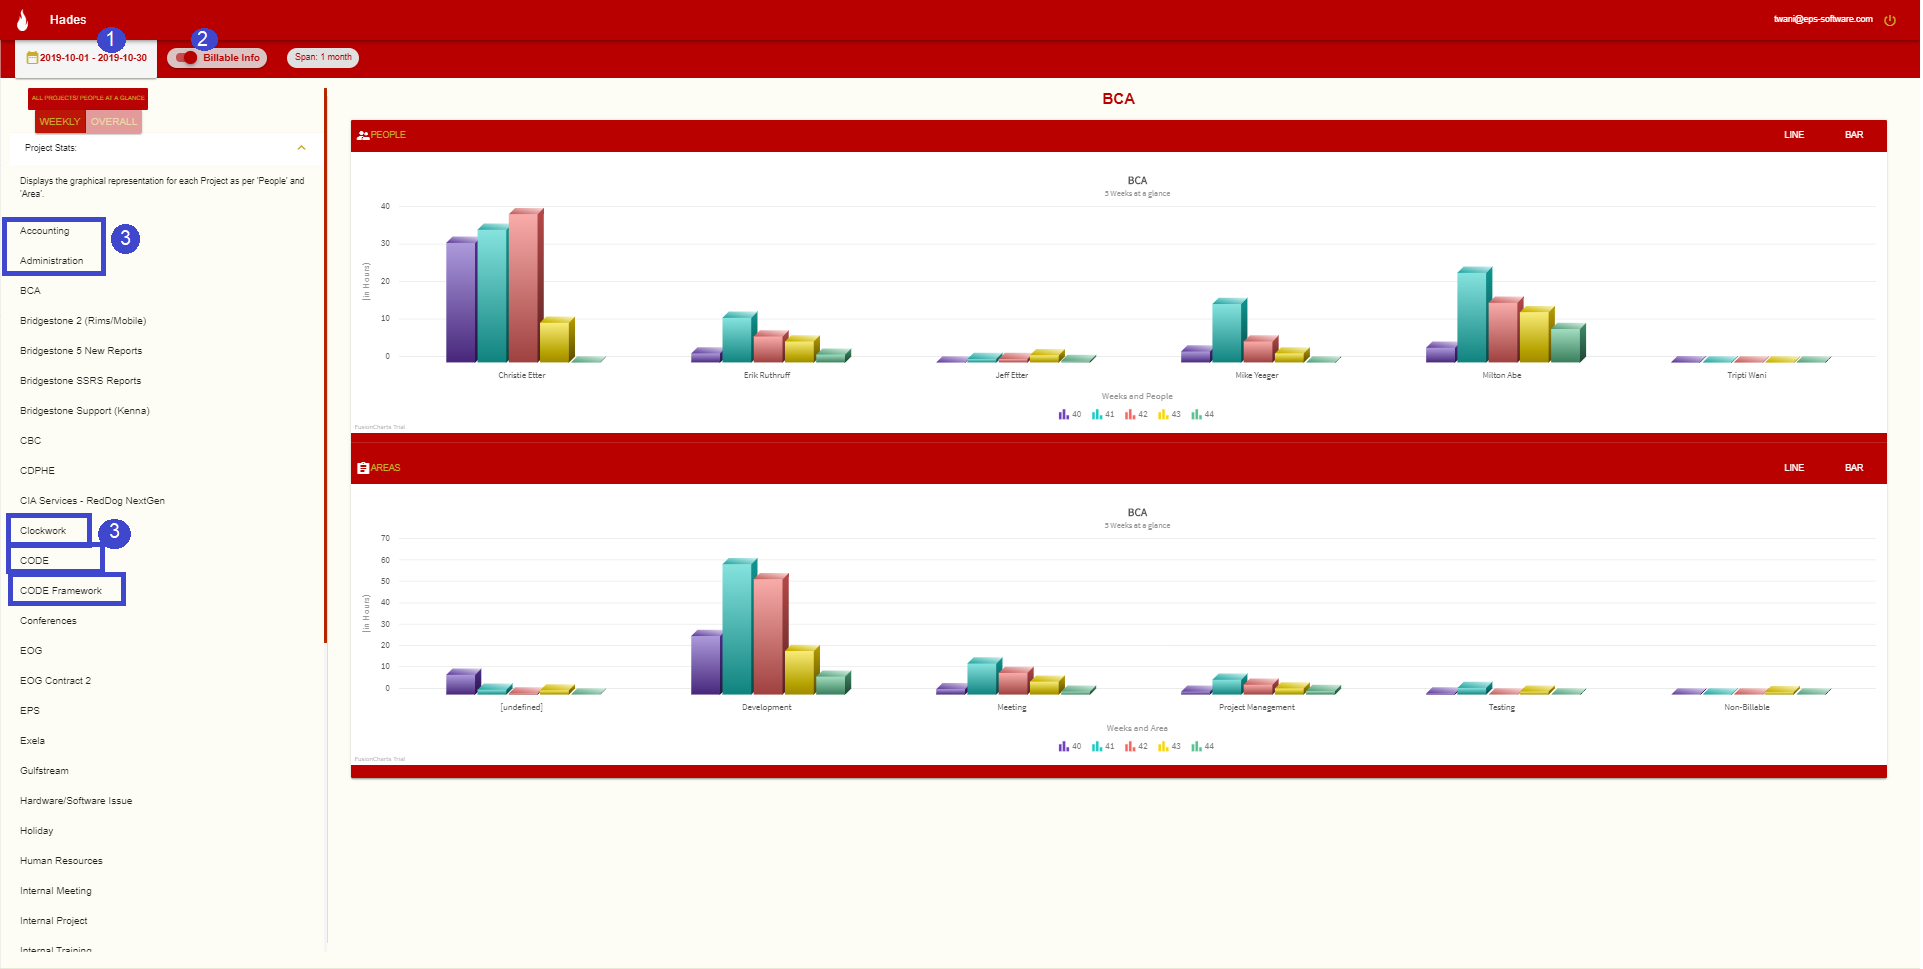
Only Billable Project Stats View - Weekly
| # | Name | Description | |
|---|---|---|---|
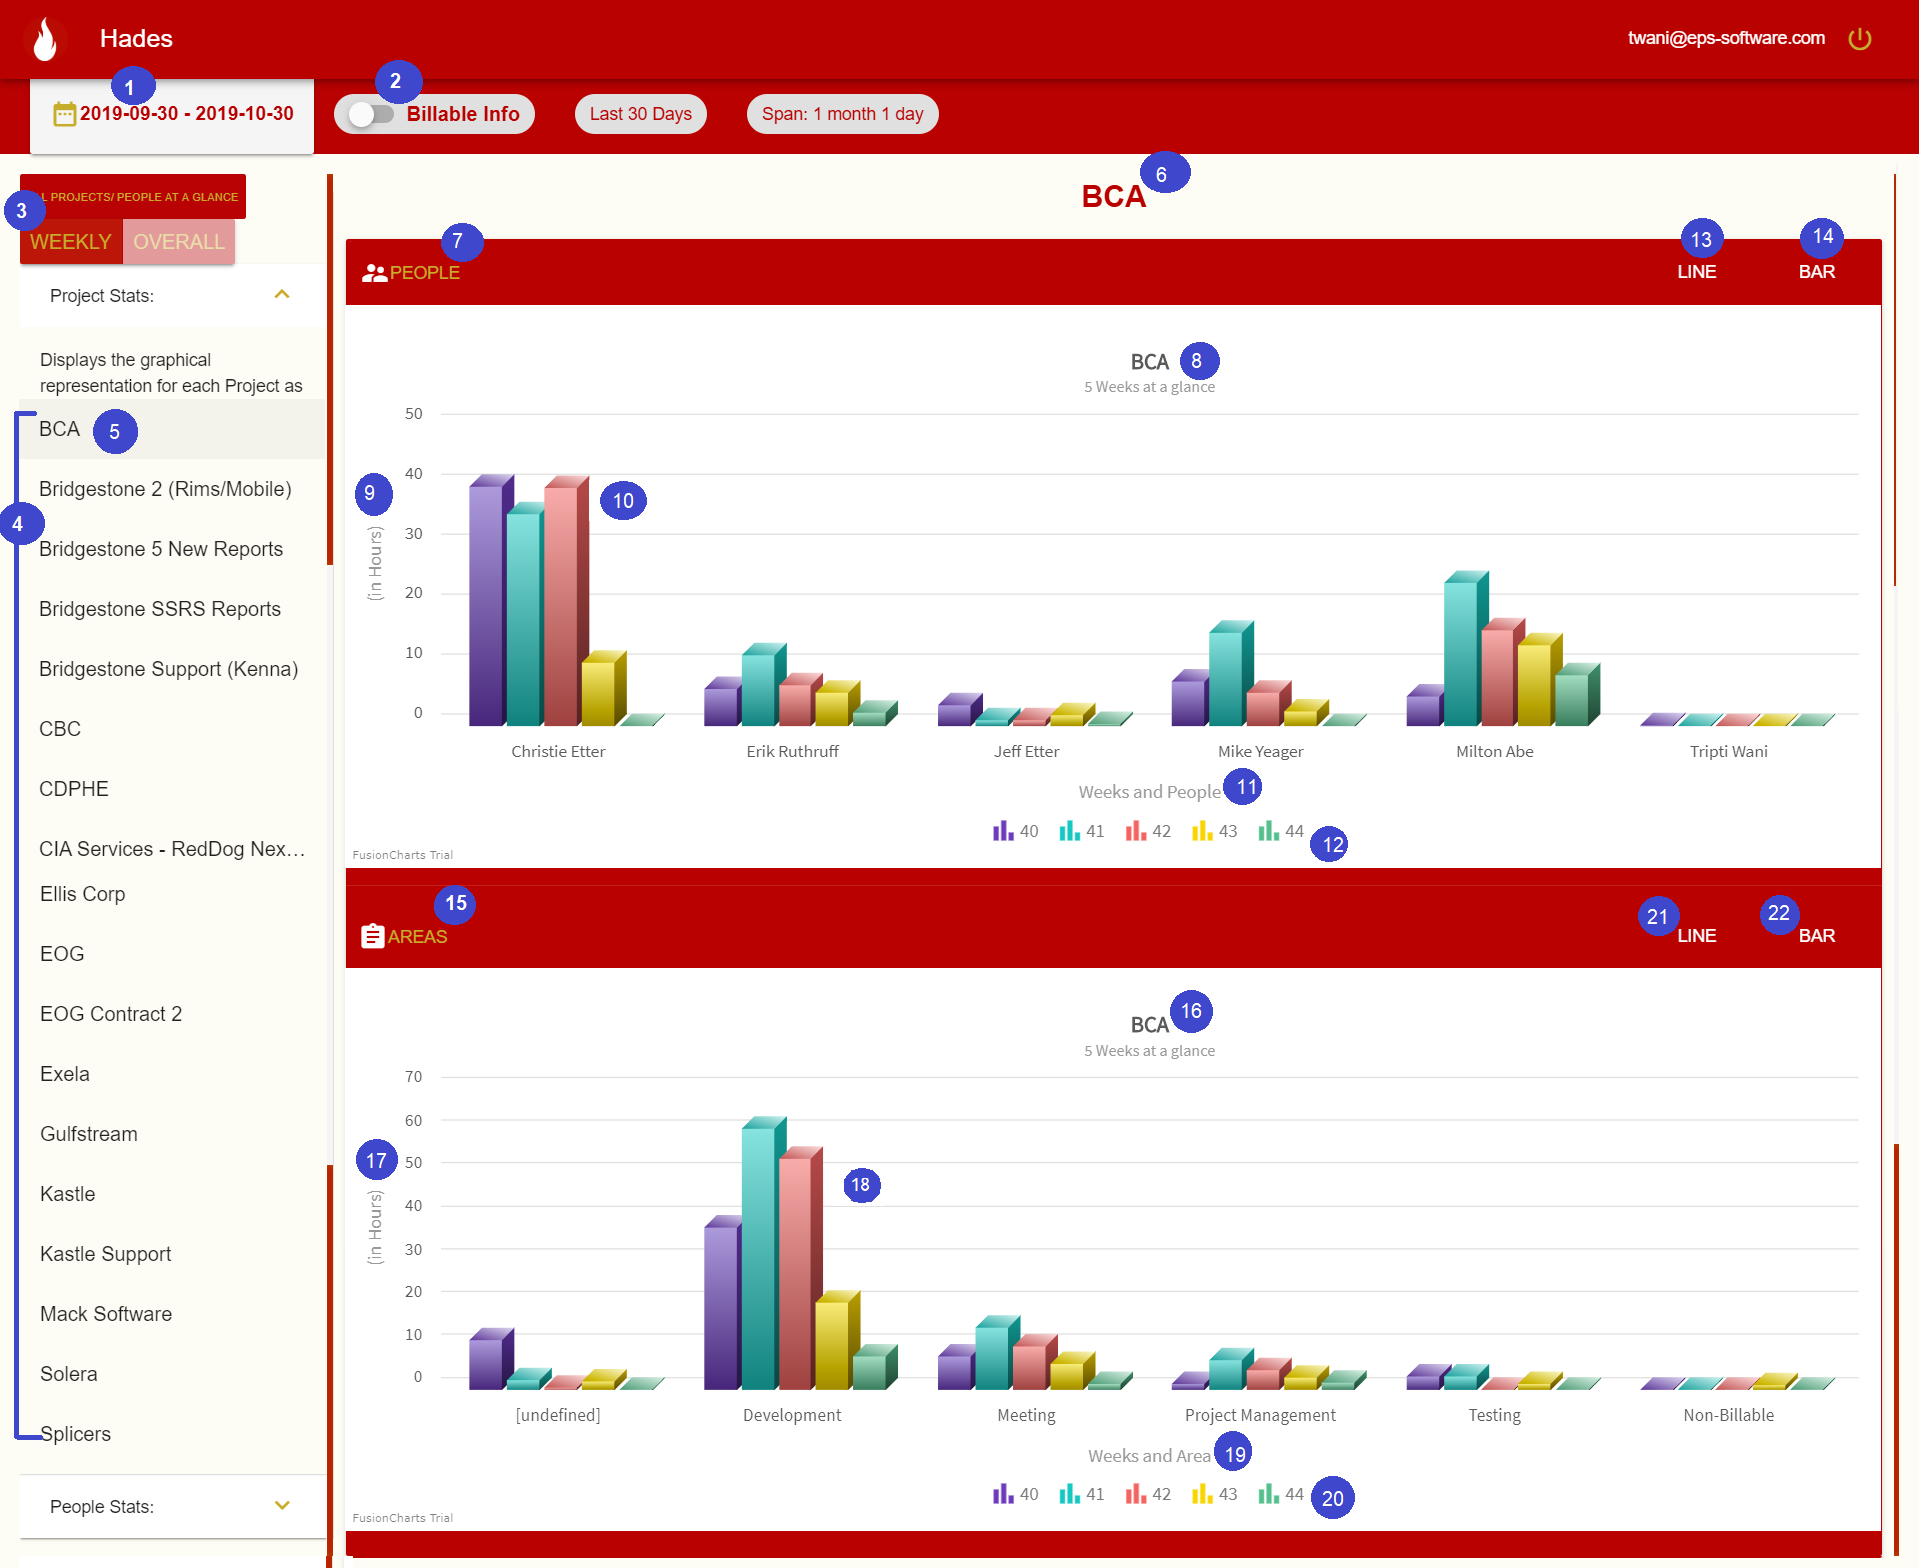
| 1 | Calendar | Upon clicking this, the calendar range box will appear, wherein the user can select the date range for the view. | |
| 2 | Billable Info | This is the switch to include or exclude the non-billable information on the charts displayed on this page. Currently the switch is off: which means non-billable information will not be displayed. | |
| 3 | Weekly | This is a toggle button to select or un-select the reports to be displayed week-wise. Currently it displays week-wise. | |
| 4 | Projects List | This is the list of all the projects which were worked upon in the selected time-range. For each Project, graphs will be displayed for ‘People’ and ‘Area’ categories. | |
| 5 | Selected Project | This label/button when clicked will display the overall charts for the selected projects for each category. | |
| 6 | Project Graphs Title | This label provides the information of the Title for which the charts have been displayed. | |
| 7 | Graph 1 Category | This label provides the name of the category for which the chart for Graph 1 is displayed. For instance, when ‘Project Stats’ is selected, the first chart on the web page is about 'People'. | |
| 8 | Graph 1 Caption | This label provides the name of the caption for which the chart for Graph 1 is displayed. It can be Project name or person name for other views. | |
| 9 | Graph 1 Y-axis | This is the y-axis for the bar graph displaying the weekly hours each person has spent on the selected project. | |
| 10 | Graph 1 | This is the 2-D bar graph displaying the time each person has spent week-wise for the time selected for this project. | |
| 11 | Graph 1 X-axis | This is the x-axis for the bar graph displaying the name of each person who has worked on the selected project. | |
| 12 | Graph 1 Chart Labels | This gives the information about the various parts of the Chart in Graph 1 above like week numbers, gives the information about the labels used. | |
| 13 | Graph 1 - Line Chart View | This button when clicked will display Graph 1 in a Line chart fashion. | |
| 14 | Graph 1 - Bar Chart View | This button when clicked will display Graph 1 in a 2-D Bar chart fashion. | |
| 15 | Graph 2 Category | This label provides the name of the category for which the chart for Graph 2 is displayed. For instance, when ‘Project Stats’ is selected, the first chart on the web page is about 'Area'. | |
| 16 | Graph 2 Caption | This label provides the name of the caption for which the chart for Graph 2 is displayed. It can be Project name or person name for other views. | |
| 17 | Graph 2 Y-axis | This is the y-axis for the bar graph displaying the weekly hours each person has spent on the selected project. | |
| 18 | Graph 2 | This is the 2-D bar graph displaying the time each person has spent week-wise for the time selected for this project. | |
| 19 | Graph 2 X-axis | This is the x-axis for the bar graph displaying the name of each area on which this selected project has been worked upon. | |
| 20 | Graph 2 Chart Labels | This gives the information about the various parts of the Chart in Graph 2 above like week numbers, gives the information about the labels used. | |
| 21 | Graph 2 - Line Chart View | This button when clicked will display Graph 1 in a Line chart fashion. | |
| 22 | Graph 2 - Bar Chart View | This button when clicked will display Graph 1 in a 2-D Bar chart fashion. |
Billable and Non-Billable Project Stats View - Weekly
 Note: This view will not be very different for Project stats as a project itself will not be present in the list if the project is non-billable.
| # | Name | Description | |
|---|---|---|---|
| 1 | Calendar | Upon clicking this, the calendar range box will appear, wherein the user can select the date range for the view. | |
| 2 | Billable Info | This is the switch to include or exclude the non-billable information on the charts displayed on this page. Currently the switch is ON: which means non-billable and billable information both will be displayed. | |
| 3 | Projects | Projects like Accounting, Clockwork, Internal Project are now in the list of projects. These will not be present if only Billable projects would have been selected using the switch at the top of the page. A few of the non-billable Projects have been outlined in blue here. |
Only Billable Project Stats View - Overall
| # | Name | Description | |
|---|---|---|---|
| 1 | Calendar | Upon clicking this, the calendar range box will appear, wherein the user can select the date range for the view. | |
| 2 | Billable Info | This is the switch to include or exclude the non-billable information on the charts displayed on this page. Currently the switch is off: which means non-billable information will not be displayed. | |
| 3 | Overall | This is a toggle button to select or un-select the reports to be displayed as overall for the time-range selected. Currently it displays Overall. | |
| 4 | Selected Project | This label/button when clicked will display the overall charts for the selected projects for each category. | |
| 5 | Projects List | This is the list of all the projects which were worked upon in the selected time-range. For each Project, graphs will be display for ‘People’ and ‘Area’ categories. | |
| 6 | Project Graphs Title | This label provides the information of the Title for which the charts have been displayed. | |
| 7 | Graph 1 Category | This label provides the name of the category for which the chart for Graph 1 is displayed. For instance, when ‘Project Stats’ is selected, the first chart on the web page is about 'People'. | |
| 8 | Graph 1 Caption | This label provides the name of the caption for which the chart for Graph 1 is displayed. It can be Project name or person name for other views. | |
| 9 | Graph 1 | This is the pie chart representation for the time spent by each person working on the selected project, for the calendar range period. Pie chart is the default view for the graphical representation. | |
| 10 | Graph 1 Chart Labels | This gives the name of all the people who have worked on the selected project in the selected time frame. | |
| 11 | Graph 1 - Line Chart View | This button when clicked will display Graph 1 in a Line chart fashion. | |
| 12 | Graph 1 - Bar Chart View | This button when clicked will display Graph 1 in a 2-D Bar chart fashion. | |
| 13 | Graph 1 - Pie Chart View | This button when clicked will display Graph 1 in a Pie chart fashion. | |
| 14 | Graph 2 Category | This label provides the name of the category for which the chart for Graph 2 is displayed. For instance, when ‘Project Stats’ is selected, the first chart on the web page is about 'Area'. | |
| 15 | Graph 2 Caption | This label provides the name of the caption for which the chart for Graph 2 is displayed. It will be Project name for this view. | |
| 16 | Graph 2 | This is the pie chart representation for the time spent on each area by all the peoplpe working on the selected project, for the calendar range period. Pie chart is the default view for the graphical representation. | |
| 17 | Graph 2 Chart Labels | This gives the name of all the areas that have been worked upon for the selected project in the selected time frame. | |
| 18 | Graph 2 - Line Chart View | This button when clicked will display Graph 2 in a Line chart fashion. | |
| 19 | Graph 2 - Bar Chart View | This button when clicked will display Graph 2 in a 2-D Bar chart fashion. | |
| 20 | Graph 2 - Pie Chart View | This button when clicked will display Graph 2 in a Pie chart fashion. | |
| 21 | Graph 1 - Download as Excel | This button when clicked will export the details present in Graph 1, i.e. details about the time each person has spent on this project in Excel(csv) format. | |
| 22 | Graph 2 - Download as Excel | This button when clicked will export the details present in Graph 2 i.e. details about the time spent on each area for this project in Excel(csv) format. | |
| 23 | Graph 1 and 2 - Download as Excel | This button when clicked will export the details present in Graph 1 and Graph 2, i.e. People and Area both category for this project in Excel(csv) format. |
Billable and Non-Billable Project Stats View - Overall
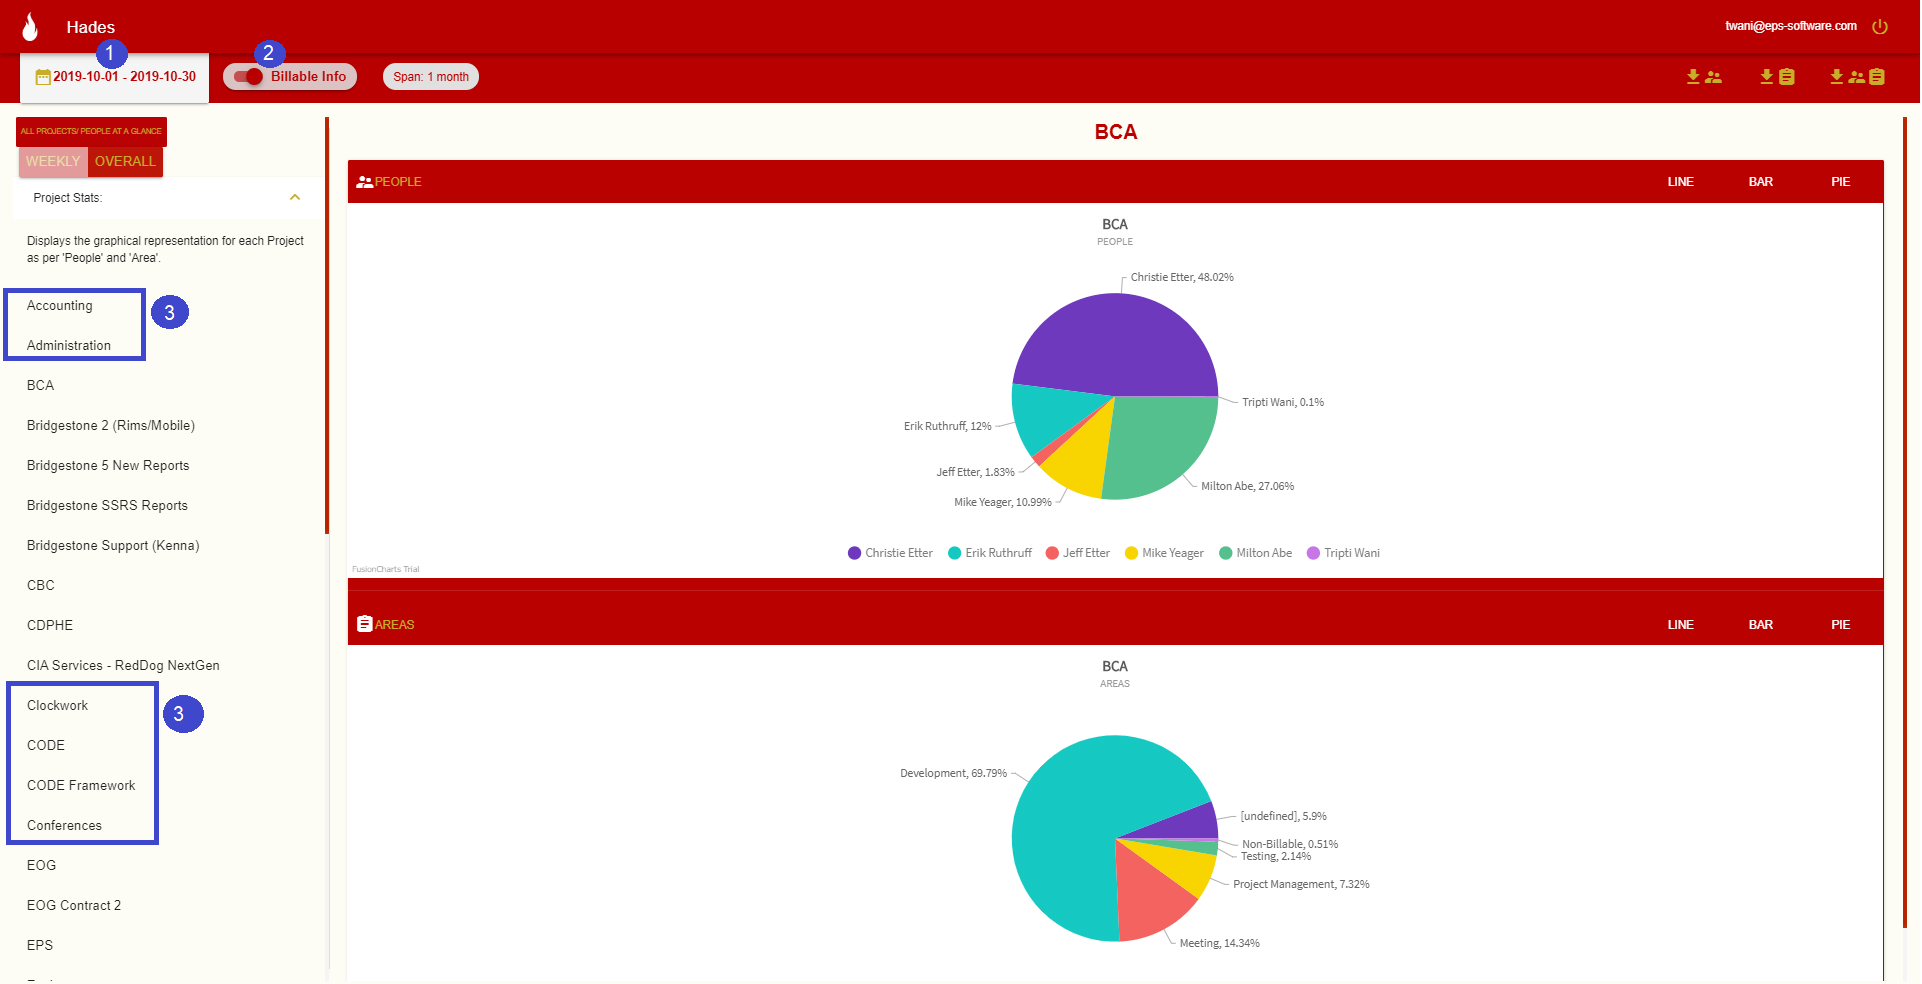 Note: This view will not be very different for Project stats as a project itself will not be present in the list if the project is non-billable.
| # | Name | Description | |
|---|---|---|---|
| 1 | Calendar | Upon clicking this, the calendar range box will appear, wherein the user can select the date range for the view. | |
| 2 | Billable Info | This is the switch to include or exclude the non-billable information on the charts displayed on this page. Currently the switch is ON: which means non-billable and billable information both will be displayed. | |
| 3 | Projects | Projects like Accounting, Clockwork, Internal Project are now in the list of projects. These will not be present if only Billable projects would have been selected using the switch at the top of the page. A few of the non-billable Projects have been outlined in blue here. |
People Stats
This section displays the graphical representation for each Person in two categories ‘Project’ and ‘Area’ for the selected time period.
Features:
- The details about time spent by the selected person for all the projects worked upon and time spent in each area can be exported in Excel format for any selected project. (available only for Overall statistics.)
- The graphical representation can be viewed in Pie charts, Bar graphs or Line charts format.
- The graphs can be displayed for weekly or overall time spent in each category for a person based on the users requirement.
Only Billable People Stats View - Weekly
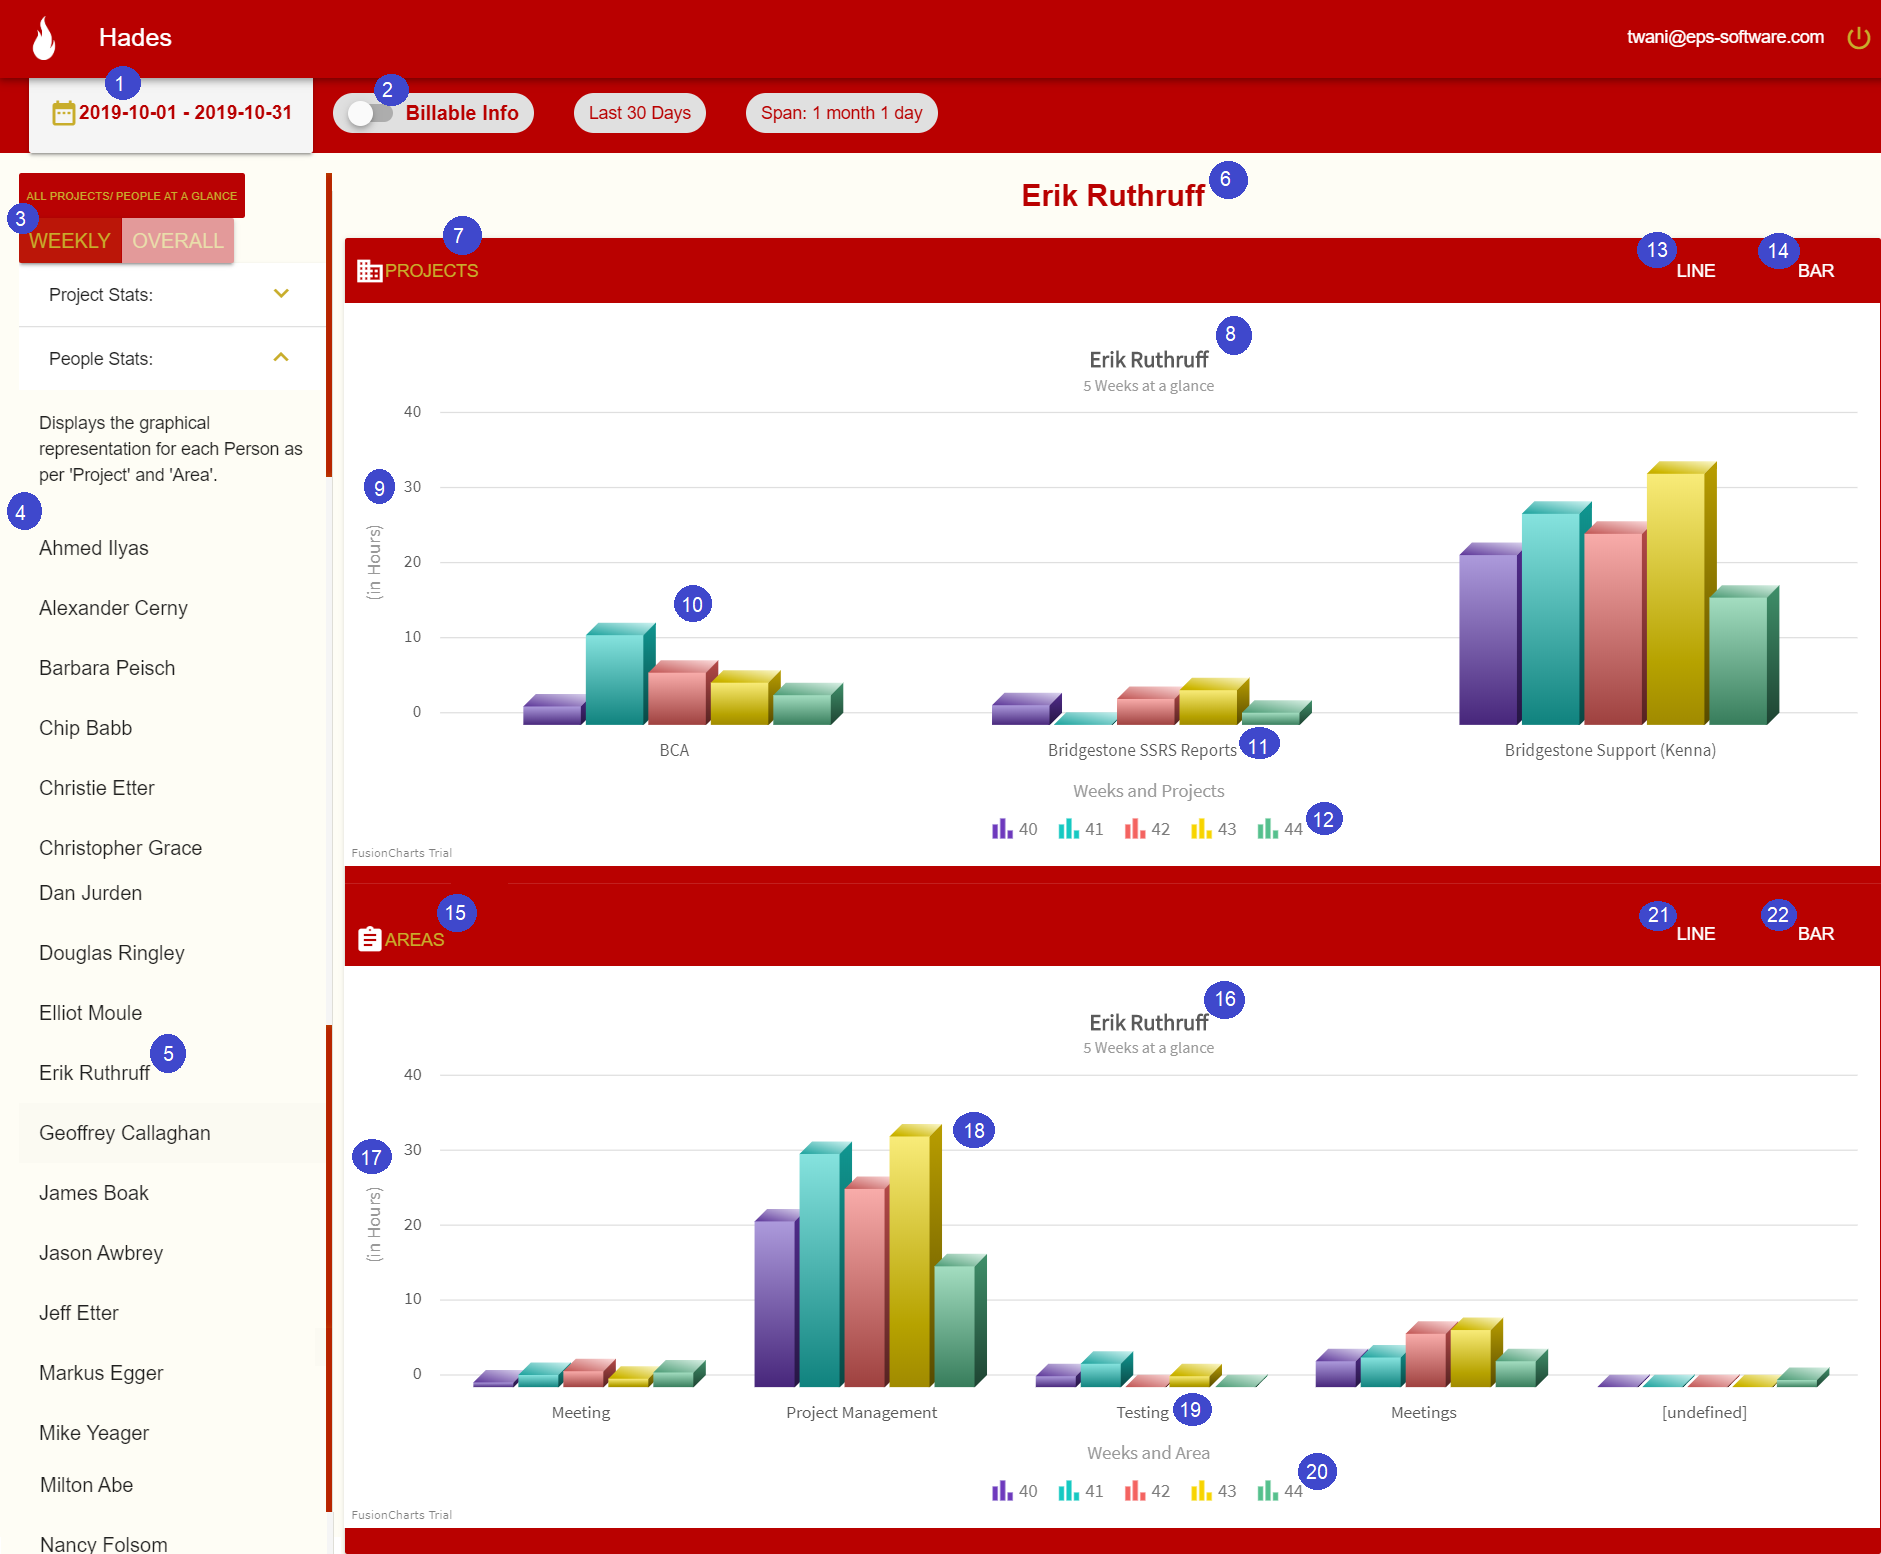
| # | Name | Description | |
|---|---|---|---|
| 1 | Calendar | Upon clicking this, the calendar range box will appear, wherein the user can select the date range for the view. | |
| 2 | Billable Info | This is the switch to include or exclude the non-billable information on the charts displayed on this page. Currently the switch is off: which means non-billable information will not be displayed. | |
| 3 | Weekly | This is a toggle button to select or un-select the reports to be displayed week-wise. Currently it displays week-wise. | |
| 4 | People List | This is the list of all the people who have worked on any billable projects in the selected time-range. For each Person, graphs will be displayed for ‘Project’ and ‘Area’ categories. | |
| 5 | Selected Person | This label/button when clicked will display the overall charts for the selected person for each category. | |
| 6 | Person Graphs Title | This label provides the information of the Title for which the charts have been displayed. | |
| 7 | Graph 1 Category | This label provides the name of the category for which the chart for Graph 1 is displayed. For instance, when ‘Person Stats’ is selected, the first chart on the web page is about 'Project'. | |
| 8 | Graph 1 Caption | This label provides the name of the caption for which the chart for Graph 1 is displayed. It will be Person name for this view. | |
| 9 | Graph 1 Y-axis | This is the y-axis for the bar graph displaying the weekly hours the selected person has spent on the each project every week. | |
| 10 | Graph 1 | This is the 2-D bar graph displaying the time the selected person has spent week-wise for the projects for the time selected. | |
| 11 | Graph 1 X-axis | This is the x-axis for the bar graph displaying the name of each project worked upon by the selected person. | |
| 12 | Graph 1 Chart Labels | This gives the information about the various parts of the Chart in Graph 1 above like week numbers, gives the information about the labels used. | |
| 13 | Graph 1 - Line Chart View | This button when clicked will display Graph 1 in a Line chart fashion. | |
| 14 | Graph 1 - Bar Chart View | This button when clicked will display Graph 1 in a 2-D Bar chart fashion. | |
| 15 | Graph 2 Category | This label provides the name of the category for which the chart for Graph 2 is displayed. For instance, when ‘Person Stats’ is selected, the first chart on the web page is about 'Area'. | |
| 16 | Graph 2 Caption | This label provides the name of the caption for which the chart for Graph 2 is displayed. It will be Person name for this view. | |
| 17 | Graph 2 Y-axis | This is the y-axis for the bar graph displaying the weekly hours the selected person has spent on the each area. | |
| 18 | Graph 2 | This is the 2-D bar graph displaying the time the selected person has spent week-wise for the time-frame selected for all the projects. | |
| 19 | Graph 2 X-axis | This is the x-axis for the bar graph displaying the name of each area on which this selected person has worked upon during the selected time-frame. | |
| 20 | Graph 2 Chart Labels | This gives the information about the various parts of the Chart in Graph 2 above like week numbers, gives the information about the labels used. | |
| 21 | Graph 2 - Line Chart View | This button when clicked will display Graph 1 in a Line chart fashion. | |
| 22 | Graph 2 - Bar Chart View | This button when clicked will display Graph 1 in a 2-D Bar chart fashion. |
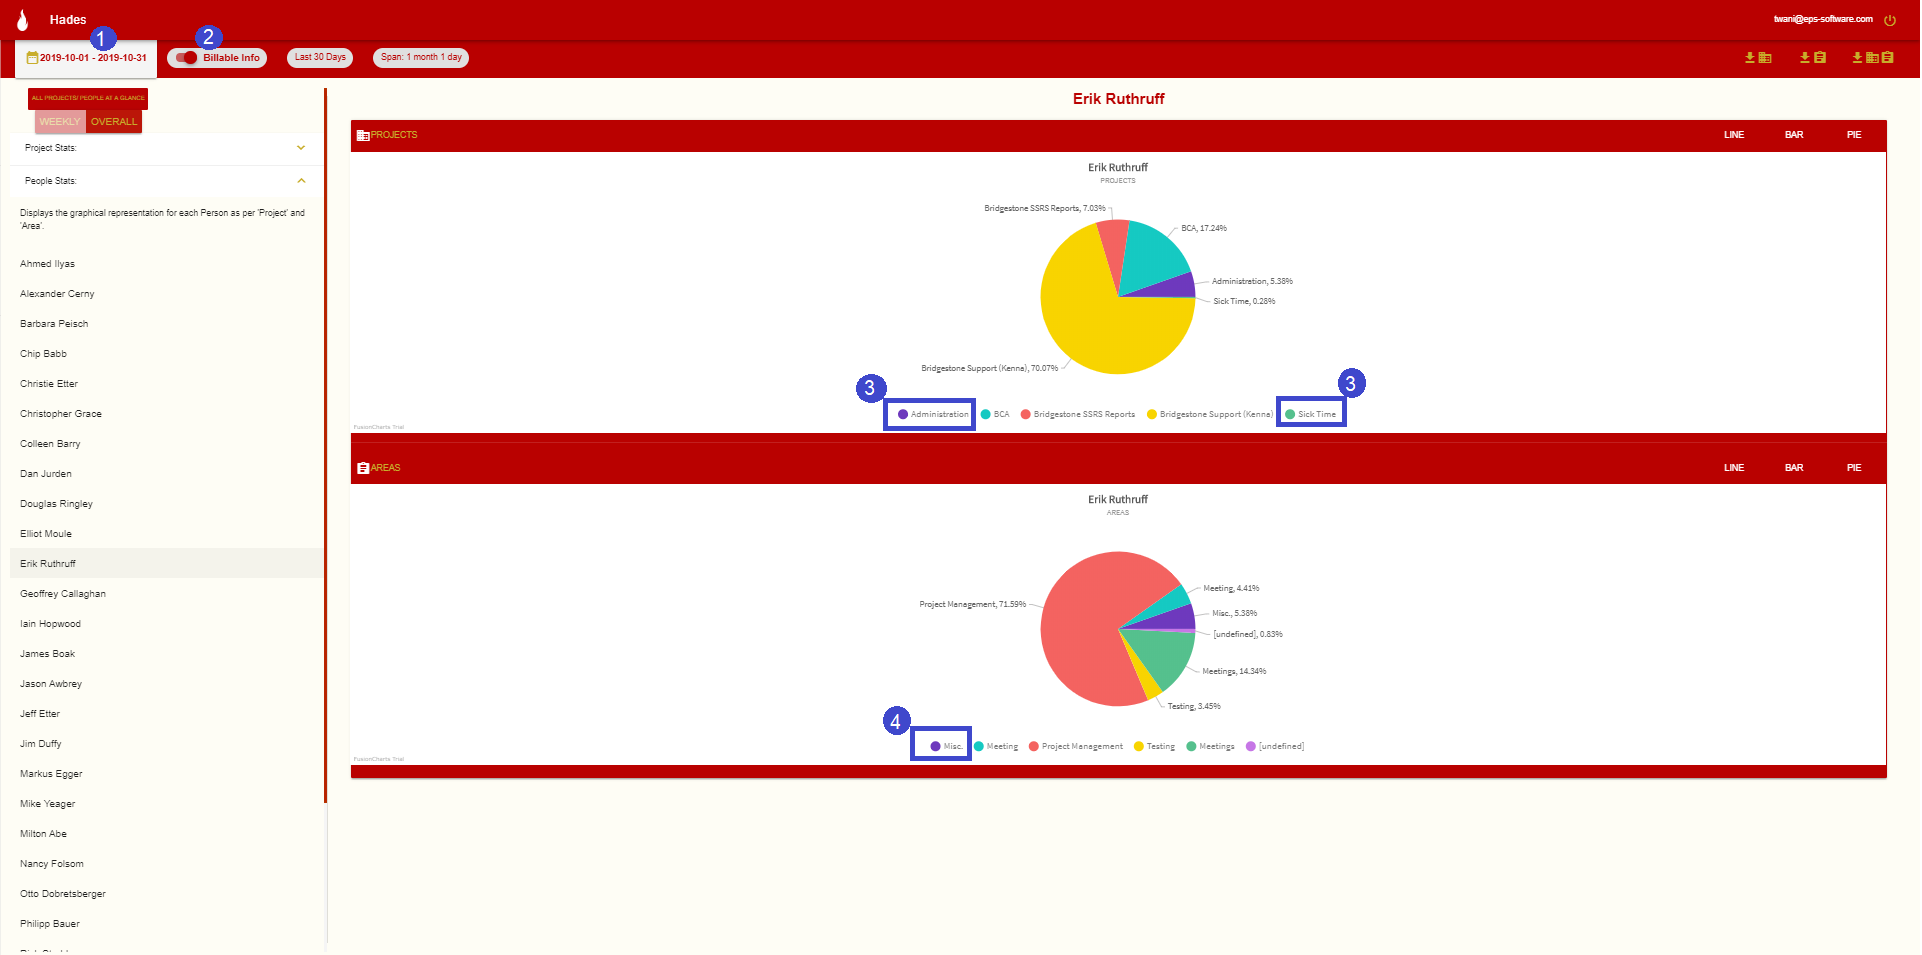
Billable and Non-Billable People Stats View - Weekly
 Note: This view may/may not be very different for Person stats above.
| # | Name | Description | |
|---|---|---|---|
| 1 | Calendar | Upon clicking this, the calendar range box will appear, wherein the user can select the date range for the view. | |
| 2 | Billable Info | This is the switch to include or exclude the non-billable information on the charts displayed on this page. Currently the switch is ON: which means non-billable and billable information both will be displayed. | |
| 3 | Projects | Projects like Administration, Sick Time will now be included in the list of projects. These will not be present if only Billable projects would have been selected using the switch at the top of the page. A few of the non-billable Projects have been outlined in blue here. | |
| 4 | Areas | Areas like Misc will now be inclued in the list of areas. These will not be present if only Billable projects would have been selected using the switch at the top of the page. A few of the non-billable Areas have been outlined in blue here. |
Only Billable People Stats View - Overall

| # | Name | Description | |
|---|---|---|---|
| 1 | Calendar | Upon clicking this, the calendar range box will appear, wherein the user can select the date range for the view. | |
| 2 | Billable Info | This is the switch to include or exclude the non-billable information on the charts displayed on this page. Currently the switch is off: which means non-billable information will not be displayed. | |
| 3 | Overall | This is a toggle button to select or un-select the reports to be displayed as overall for the time-range selected. Currently it displays Overall. | |
| 4 | Selected Person | This label/button when clicked will display the overall charts for the selected person for each category. | |
| 5 | People List | This is the list of all the people who have worked on any billable projects in the selected time-range. For each Person, graphs will be displayed for ‘Project’ and ‘Area’ categories. | |
| 6 | People Graphs Title | This label provides the information of the Title for which the charts have been displayed. | |
| 7 | Graph 1 Category | This label provides the name of the category for which the chart for Graph 1 is displayed. For instance, when ‘People Stats’ is selected, the first chart on the web page is about 'Project'. | |
| 8 | Graph 1 Caption | This label provides the name of the caption for which the chart for Graph 1 is displayed. It will be Person name for this view. | |
| 9 | Graph 1 | This is the pie chart representation for the time spent by the selected person on all the projects, for the calendar range period. Pie chart is the default view for the graphical representation. | |
| 10 | Graph 1 Chart Labels | This gives the name of all the projects worked upon by the selected person in the calendar range period. | |
| 11 | Graph 1 - Line Chart View | This button when clicked will display Graph 1 in a Line chart fashion. | |
| 12 | Graph 1 - Bar Chart View | This button when clicked will display Graph 1 in a 2-D Bar chart fashion. | |
| 13 | Graph 1 - Pie Chart View | This button when clicked will display Graph 1 in a Pie chart fashion. | |
| 14 | Graph 2 Category | This label provides the name of the category for which the chart for Graph 2 is displayed. For instance, when ‘Person Stats’ is selected, the first chart on the web page is about 'Area'. | |
| 15 | Graph 2 Caption | This label provides the name of the caption for which the chart for Graph 2 is displayed. It will be Person name for this view. | |
| 16 | Graph 2 | This is the pie chart representation for the time spent by the selected person on all the areas, for the calendar range period. Pie chart is the default view for the graphical representation. | |
| 17 | Graph 2 Chart Labels | This gives the name of all the areas that have been worked upon by the selected person in the selected time frame. | |
| 18 | Graph 2 - Line Chart View | This button when clicked will display Graph 2 in a Line chart fashion. | |
| 19 | Graph 2 - Bar Chart View | This button when clicked will display Graph 2 in a 2-D Bar chart fashion. | |
| 20 | Graph 2 - Pie Chart View | This button when clicked will display Graph 2 in a Pie chart fashion. | |
| 21 | Graph 1 - Download as Excel | This button when clicked will export the details present in Graph 1, i.e. details about the time this person has spent on each project in Excel(csv) format. | |
| 22 | Graph 2 - Download as Excel | This button when clicked will export the details present in Graph 2 i.e. details about the time spent on each area by this person in Excel(csv) format. | |
| 23 | Graph 1 and 2 - Download as Excel | This button when clicked will export the details present in Graph 1 and Graph 2, i.e. Project and Area both category for this person in Excel(csv) format. |
Billable and Non-Billable People Stats View - Overall
 Note: This view may/may not be very different for Person stats above.
| # | Name | Description | |
|---|---|---|---|
| 1 | Calendar | Upon clicking this, the calendar range box will appear, wherein the user can select the date range for the view. | |
| 2 | Billable Info | This is the switch to include or exclude the non-billable information on the charts displayed on this page. Currently the switch is ON: which means non-billable and billable information both will be displayed. | |
| 3 | Projects | Projects like Administration, Sick Time will now be included in the list of projects. These will not be present if only Billable projects would have been selected using the switch at the top of the page. A few of the non-billable Projects have been outlined in blue here. | |
| 4 | Areas | Areas like Misc will now be inclued in the list of areas. These will not be present if only Billable projects would have been selected using the switch at the top of the page. A few of the non-billable Areas have been outlined in blue here. |
Mobile View
So to make the Reports available for any device, styling has been added for smaller monitors, and mobile devices. The view is dynamic and responsive, and will update as the size of the page handle is changed. The mobile view operates identically to the larger version, just some controls are resized to fit more comfortably.
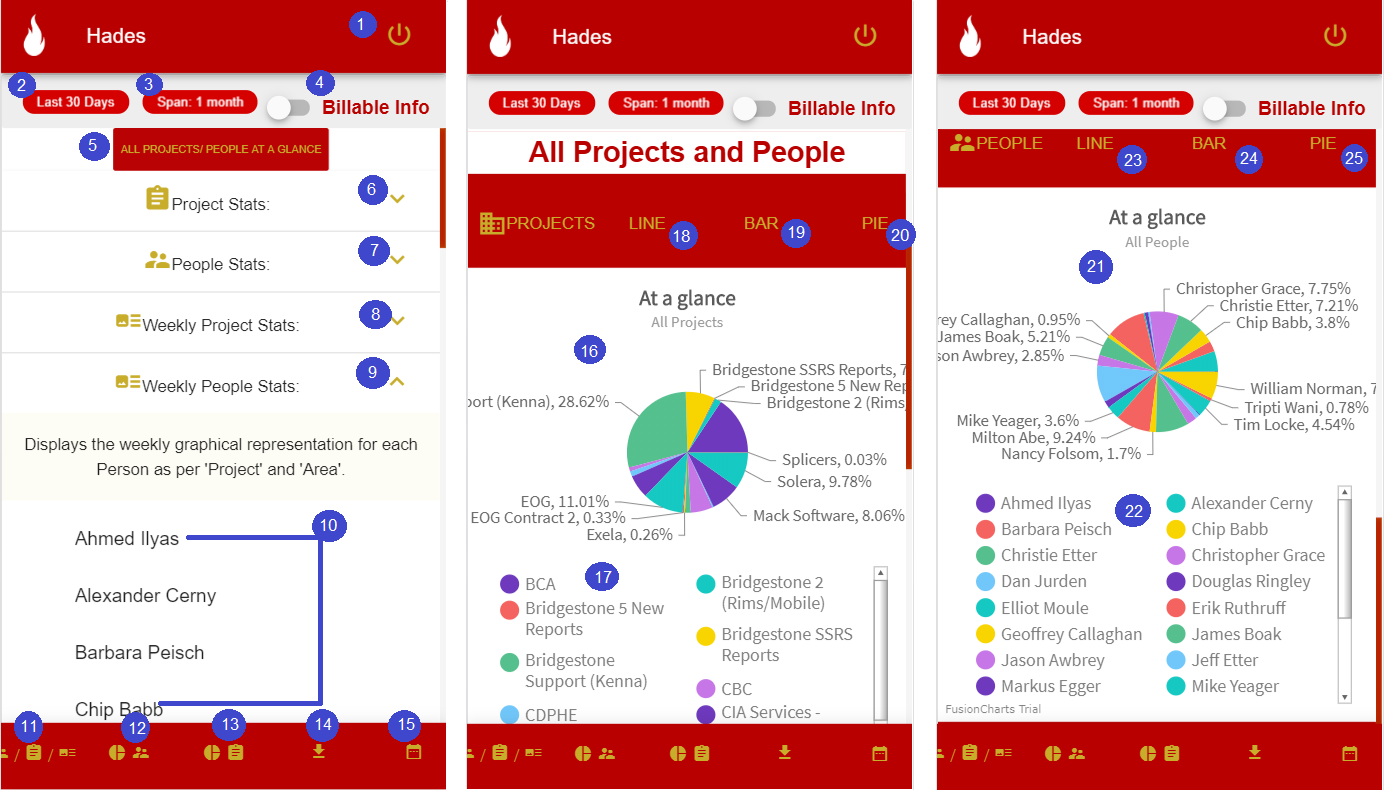
Overall Mobile View
| # | Name | Description |
|---|---|---|
| 1 | Log Out | Upon clicking this button, the user will be logged out, and their session cleared. |
| 2 | Selected Calendar Preset | This chip provides the currently selected calendar preset. |
| 3 | Time Span | This chip provides the time span between the two selected range dates. This number is inclusive of the last selected day (so may look to be one more day than realized). |
| 4 | Billable Info | This is the switch to include or exclude the non-billable information on the charts displayed on this page. Currently the switch is OFF: which means only billable information will be displayed. |
| 5 | All Projects/People at a glance | This label/button when clicked will display the overall charts for all the projects and people, irrespective of the projects and areas they work upon. |
| 6 | Project Stats | This label is the expansion panel to display the graphical representation for each Project as per ‘People’ and ‘Area’. It expands to a list of all the projects being worked upon in the selected time period. |
| 7 | People Stats | This label is the expansion panel to display the graphical representation for each Person as per ‘Project’ and ‘Area’. It expands to a list of all the people who have worked during the selected time period. |
| 8 | Weekly Project Stats | This label is the expansion panel to display the graphical representation for each Project as per ‘People’ and ‘Area’ week-wise. It expands to a list of all the projects being worked upon in the selected time period. |
| 9 | Weekly People Stats | This label is the expansion panel to display the graphical representation for each Person as per ‘Project’ and 'Area'week-wise. It expands to a list of all the people who have worked during the selected time period. |
| 10 | Projects/People List | Mirroring the desktop view, mobile view provides a list of projects,people which can be selected to view the details in the graphical representation. |
| 11 | Projects/People List View | Clicking this button will provide the Projects List/People List/Weekly Projects List/Weekly People List, which provides a list of projects, with all people whom worked on that project, and their associated areas. This view works the same as the desktop version, just looks different. |
| 12 | Graph 1 shortcut | Clicking this button will take the user to the Graph 1 (Pie chart about All Projects in this case), irrespective of the grpah type selected. |
| 13 | Graph 2 shortcut | Clicking this button will take the user to the Graph 2 (Pie chart about All People in this case), irrespective of the grpah type selected. |
| 14 | Downloads shortcut | Clicking this button will open the dialog to download the projects/people details as Excel(csv) format.This download feature works the same way the desktop view |
| 15 | Calendar | Clicking this button will open the mobile calendar, range picker. This calendar works the same way the desktop does, though does not include the ability for the user to type in a date (they must use the date pickers). |
| 16 | Graph 1 Pie Chart | This is the pie chart representation of all the projects within the company, for the calendar range period. Pie chart is the default view for the graphical representation. |
| 17 | Graph 1 Pie Chart Labels | This gives the information about the various parts of the Pie Chart in Graph 1 above, gives the information about the labels. |
| 18 | Graph 1 - Line Chart View | This button when clicked will display Graph 1 in a Line chart fashion. |
| 19 | Graph 1 - Bar Chart View | This button when clicked will display Graph 1 in a 2-D Bar chart fashion. |
| 20 | Graph 1 - Pie Chart View | This button when clicked will display Graph 1 in a Pie chart fashion. |
| 21 | Graph 2 Pie Chart | This is the pie chart representation of all the people within the company, for the calendar range period. Pie chart is the default view for the graphical representation. |
| 22 | Graph 2 Pie Chart Labels | This gives the information about the various parts of the Pie Chart in Graph 2 above, gives the information about the labels. |
| 23 | Graph 2 - Line Chart View | This button when clicked will display Graph 2 in a Line chart fashion. |
| 24 | Graph 2 - Bar Chart View | This button when clicked will display Graph 2 in a 2-D Bar chart fashion. |
| 25 | Graph 2 - Pie Chart View | This button when clicked will display Graph 2 in a Pie chart fashion. |
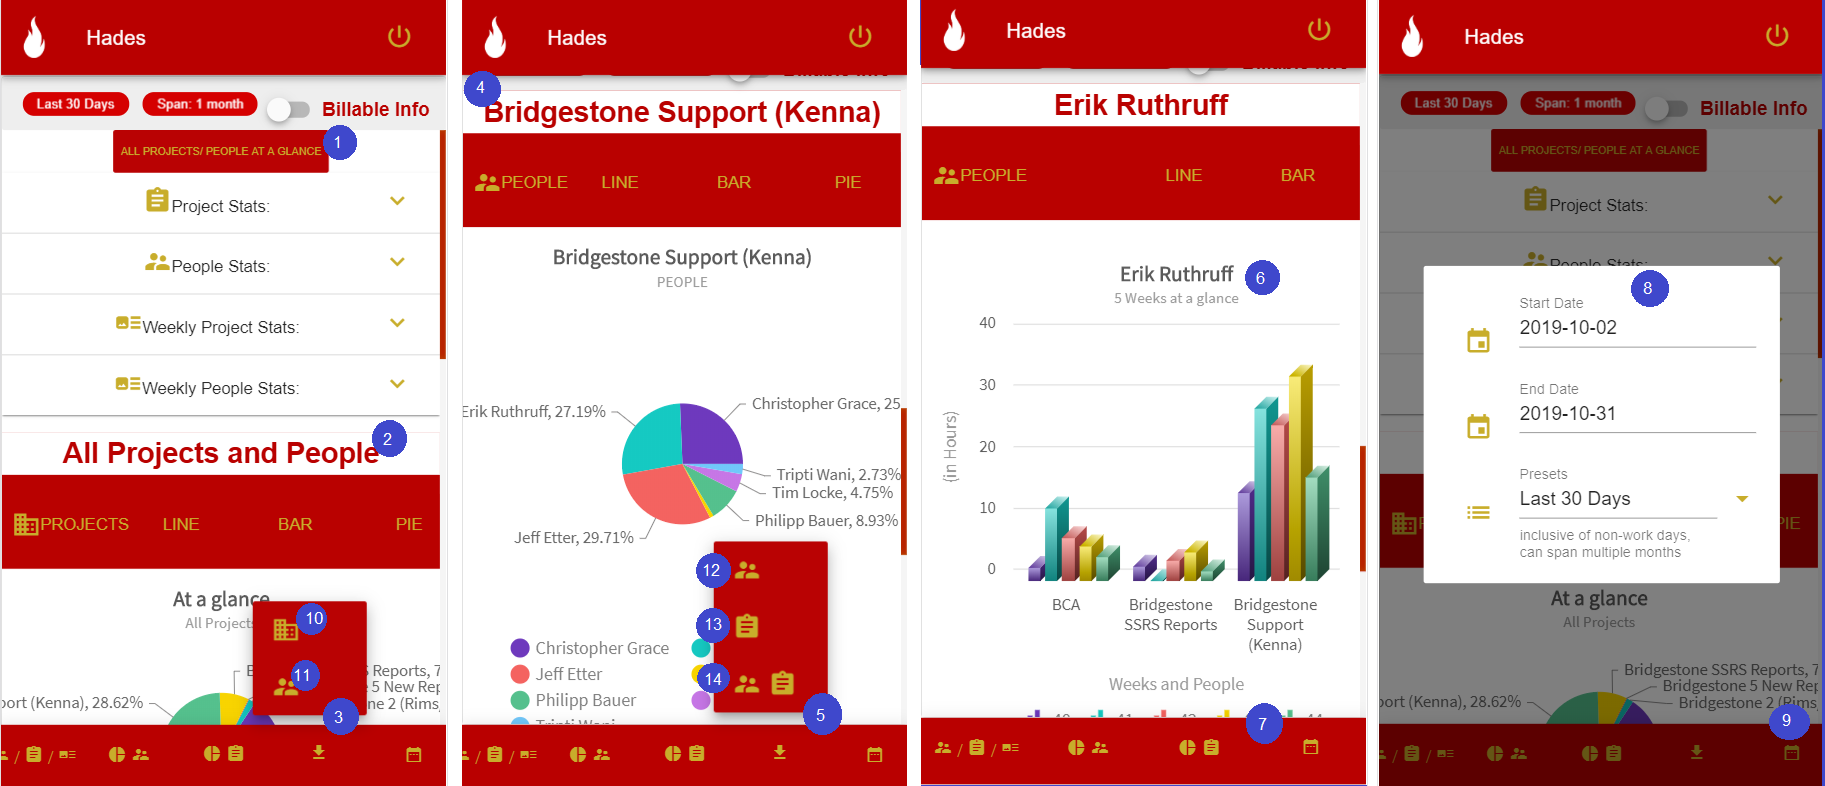
Mobile View Controls
| # | Name | Description |
|---|---|---|
| 1 | All Projects/People at a glance | This label/button when clicked will display the overall charts for all the projects and people, irrespective of the projects and areas they work upon. |
| 2 | Graphs Title | This label provides the information of the Title for which the charts have been displayed. |
| 3 | Downloads shortcut | Clicking this button will open the dialog containing 2 buttons(10 and 11 mentioned below) to download the projects/people details as Excel(csv) format.This download feature works the same way the desktop view |
| 4 | Project/Person Graphs Title | This label provides the information of the Title for which the charts have been displayed. |
| 5 | Downloads shortcut | Clicking this button will open the dialog containing 3 buttons(12, 13 and 14 mentioned below) to download the projects/people details as Excel(csv) format.This download feature works the same way the desktop view |
| 6 | Weekly view (Project/Person Graphs Title) | This label provides the information of the Title for which the charts have been displayed. |
| 7 | Downloads shortcut | As we can notice, there is no download button for the Weekly reports. This feature works the same way the desktop view. |
| 8 | Calendar | Clicking this button will open the mobile calendar, range picker. |
| 9 | Calendar Picker | This calendar works the same way the desktop does, though does not include the ability for the user to type in a date (they must use the date pickers). |
| 10 | Graph 1 - Download as Excel | This button when clicked will export the details present in Graph 1 in Excel(csv) format. |
| 11 | Graph 2 - Download as Excel | This button when clicked will export the details present in Graph 2 in Excel(csv) format. |
| 12 | Graph 1 - Download as Excel | This button when clicked will export the details present in Graph 1, i.e. details about the time each person has spent on this project in Excel(csv) format. |
| 13 | Graph 2 - Download as Excel | This button when clicked will export the details present in Graph 2 i.e. details about the time spent on each area for this project in Excel(csv) format. |
| 14 | Graph 1 and 2 - Download as Excel | This button when clicked will export the details present in Graph 1 and Graph 2, i.e. People and Area both category for this project in Excel(csv) format. |